BCG Matrix
The BCG Matrix (Growth-Share Matrix) was created in the late 1960s by the founder of the Boston Consulting Group, Bruce Henderson, as a tool to help his clients with efficient allocation of resources among different business units. It has since been used as a portfolio planning and analysis tool for marketing, brand management and strategy development.
In order to ensure successful long-term operation, every business organization should have a portfolio of products/services rather than just one product or service. This portfolio should contain both high-growth and low-growth products/services. High-growth products have the potential to generate lots of cash but also require substantial amounts of investment. Low-growth products with high market share, on the other hand, generate lots of cash while needing minimal investment.

The BCG Matrix helps a company with multiple business units/products by determining the strengths of each business unit/product and the course of action for each business unit/product. An understanding of these factors will give the company the highest probability of winning against its competitors, since the intelligence generated can be used to develop portfolio management strategies.
The BCG Matrix helps managers classify business units/products as low or high performers using the following criteria:
- 1. Relative market share (strength of a business unit's position in that market)
- 2. Market growth rate (attractiveness of the market in which a business unit operates)
Relative market share (RMS) is the percentage of the total market that is being controlled by the company being analyzed. It is calculated using the following formula:
RMS = Unit sales this year / Unit sales this year by a leading rival
The relative market share is measured on a scale where 1.0 is considered a cut-off point. An RMS of more than 1.0 indicates that this company/product/business unit has a higher market share than the leading competitor.
Market growth (MGR) is used as a measure of a market’s attractiveness. It is calculated using the following formula:
MGR = (Individual sales this year - individual sales last year) / Individual sales last year
High growth markets are the ones where the total available market share is expanding, offering plenty of opportunity for everyone to make money. Traditionally, a market growth rate of 10% has been used as a cut-off point for the purpose of classifying the units in the business portfolio. Any unit with a growth rate of more than 10% would be placed in the high growth segment of the BCG Matrix.
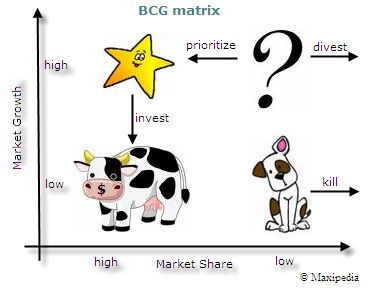
This classification places business units/products in the following four categories:
- 1. Stars – BUs/products characterized by high-growth and high- market share. They often require heavy external investment to sustain their rapid growth as they may not be producing any positive cash flow. Eventually, their growth will slow, and they will turn into cash cows.
- 2. Cash Cows - BUs/products characterized by low-growth, high-market share. These are well established and successful BUs that do not require substantial investment to keep their market share. They produce a lot of cash to be used for other business units (Stars and Question Marks) of the company.
- 3. Question Marks - BUs/products characterized by low-market share in high-growth markets. They require a lot of financial resources to increase their share since they cannot generate enough cash themselves. The crucial decision is to decide which Question Marks to phase out and which ones to grow into Stars.
- 4. Dogs - BUs/products with low-growth, low-market share. In addition, they often have poor profitability. The business strategy for a Dog is most often to divest. However, occasionally management might make a decision to hold a Dog for possible strategic repositioning as a Question Mark or Cash Cow.
The BCG model follows the following major steps:
- 1. Identify major organizational business units (BUs) and identify RMS and MGR for each BU
- 2. Plot the BUs on the BCG Matrix
- 3. Classify the BUs as Question Marks, Stars, Cash Cows and Dogs
- 4. Develop strategies for each BU based on their position and movement trends within the matrix

Strengths of the BCG Model:
- The BCG Matrix allows for a visual presentation of the competitive position of all units in a business portfolio.
- The BCG model allows companies to develop a customized strategy for each product or business unit instead of having a one-size-fits-all approach.
- Simple and easy to understand.
- It works well for companies with multiple divisions and products
- Allows for quick and simple screening of business opportunities in order to determine investment priorities in the portfolio of products/business units.
- It is used to identify how corporate cash resources can be best allocated to maximize a company’s future growth and profitability.
- Useful for the development of investment, marketing and operating decisions:
- a. Investment in the business unit in order to build its market share
- b. Sufficient investment to maintain the business unit's market share at the current level
- c. Determine which business unit/product will function as a cash cow to provide necessary cash flow for the other business units/products
- d. Divest a business unit
Weaknesses of the BCG Model:
- The BCG model assumes that high market share and market growth are the only success factors. Based on numerous real life examples, we can conclude that high market share does not always lead to profitability. Businesses with low market share can be highly profitable as well. Relative market strength is also determined by the following factors which the BCG does not take into account:
- a. Technological competence
- b. Ability to maintain low manufacturing costs
- c. Financial strength of competition
- d. Distribution capabilities
- e. Human resources
- The BCG model focuses on major competitors when analyzing the relative market share of a company. However, it neglects some small competitors with fast growing market shares.
- It is a rather short-term model that doesn’t fully show how characteristics of business units change over the long term.
- The BCG model is more focused on business units than individual products
- Assumes that high rates of profit are directly related to high market share
- The BCG model looks at a business unit in isolation without taking into consideration the possible cooperation among various business units within the organization
- BCG is a primarily qualitative model
- The Y axis represents the annual market growth which fails to see the full picture that goes beyond a one year span
- It does not take into consideration other important factors such as: market barriers/restrictions, market density, profitability, politics
- With this or any other such analytical tool, ranking business units has a subjective element involving guesswork about the future, particularly with respect to growth rates.


Comments
Post a Comment